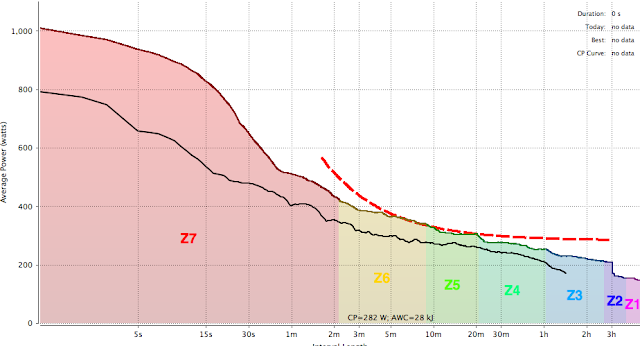
I bought my power meter in early September so I now have almost 4 months of training data, including 3 races in November. You can see in the chart above that my max output was 1,011 watts. The wattage drops off quickly until approximately 3 minutes but declines at a very slow rate thereafter.
As I blogged in September, the data proves that sprinting is not my strength. I am, however, pretty good at efforts approaching 5 minutes and greater.
The data above compares my pre-season testing in September (orange boxes) to my best performances later in November and December (red boxes). The red box results were typically races, group threshold rides, or individual tests.
My pre-season results were fairly poor, as you would expect. And my mid-season 5 second and 1 minute results are still Cat 4 and 5. But my 5 minute and 20 minute outputs improved significantly putting me squarely in Cat 2 territory.
The 5 and 20 minute outputs are great news if the Auckland area offered races with long climbs. Unfortunately, the only race we have for that is K1 and K2, and I didn't have a great race that day.
Realizing that I can only hold 400 watts for less than 3 minutes is pretty discouraging knowing that the best pros in the world can sustain 400w for 30+ minutes.
Although my outputs are improving, my training schedule has been similar to my 2012/2013 season training schedule - that is, the same group rides on Saturdays, Sundays, and Wednesdays. I was aiming to incorporate more variation this season, which so far has not really happened.
December was a big month for my training; not in terms of hours, but days riding. I rode 15 out of 16 days in one training block and 19 out of 22 days in the extended block.
Again, these weren't always long rides, but most were intense sessions or recovery rides. Suffice to say I needed a break by the end of December.
The Performance Management Chart below shows my training load since early September when I bought my power meter. The vertical bars show the training stress score for individual rides. The green line shows short-term fatigue. The blue line shows long-term fatigue.
It takes me about a week to recover from severe short term stress (the green line) such as a race or really hard weekend of training. The blue line takes much longer. Once I complete my first ride after our holiday in Bali, I'll be able to see how far the blue line has shifted back towards zero.
For the 2013 year, I did 196 rides and almost 11,000km, which was fairly consistent with 2011 and 2012.


That's good feedback you are getting on yourself.
ReplyDeleteFor comparison, my 2013 stats: 15,066 km, 338 rides
Sub Totals: 9,659 km in 166 outdoor rides; 5,407 km in 172 indoor rides
Bali sounds nice!
woah - those are very impressive numbers, Dave! 6.5 days per week!
Delete